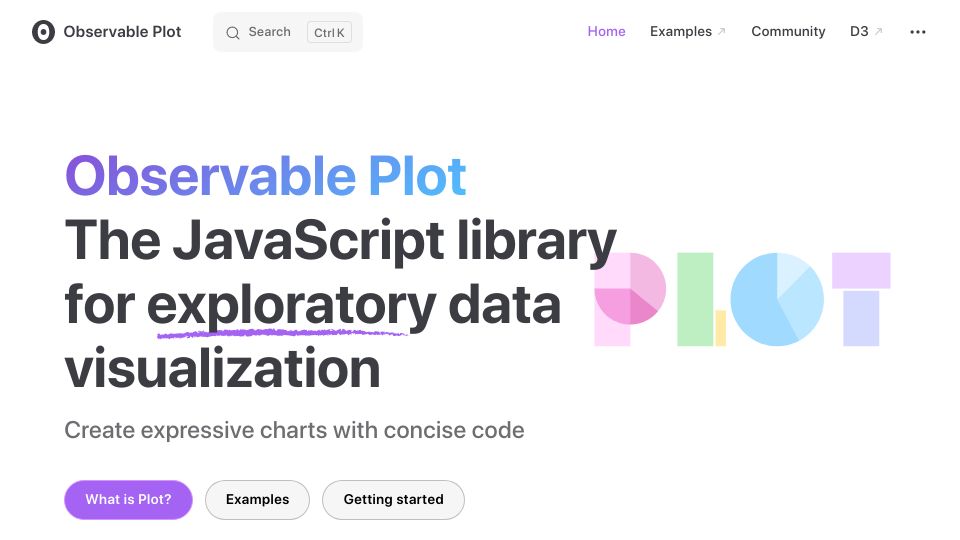
Observable Plot: A JavaScript library for exploratory data visualization(observablehq.com)178 points by mbostock 3 years ago | 41 comments
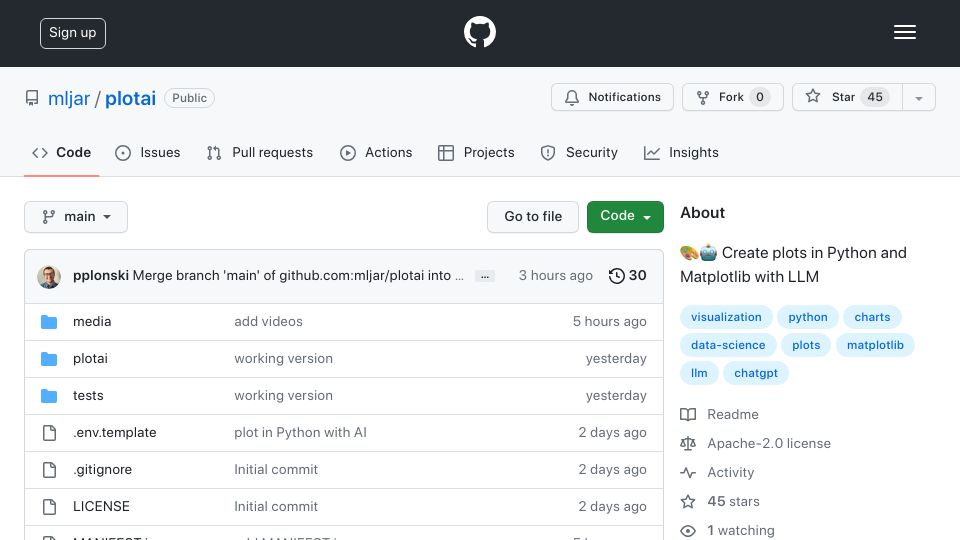
Show HN: PlotAI – Create Plots in Python and Matplotlib with LLM(github.com)39 points by pplonski86 3 years ago | 11 comments
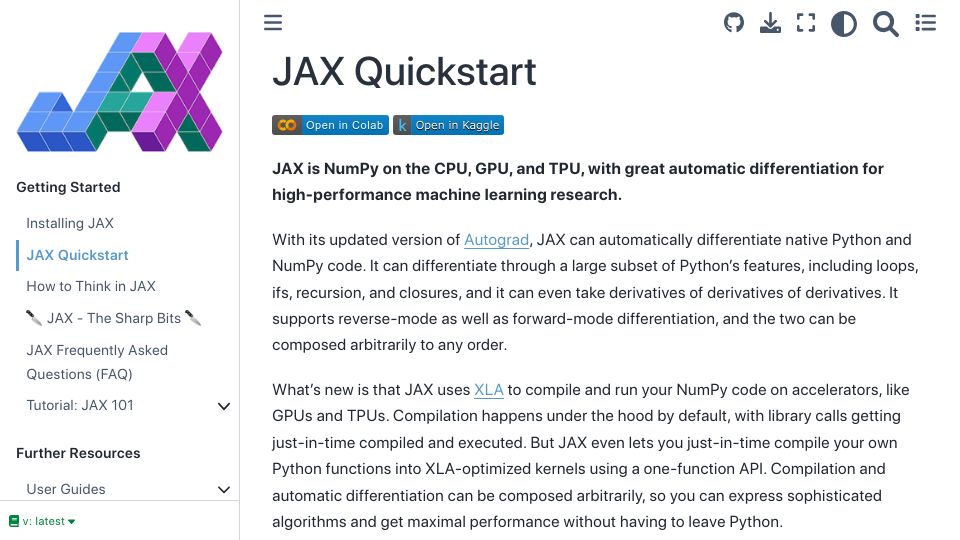
JAX – NumPy on the CPU, GPU, and TPU(jax.readthedocs.io)234 points by peter_d_sherman 3 years ago | 129 comments
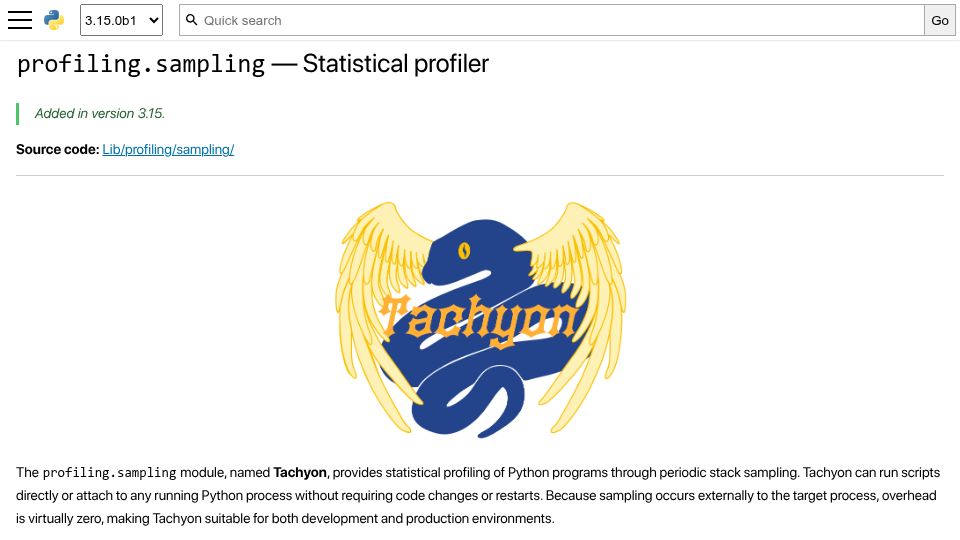
Profiling.sampling – Statistical Profiler(docs.python.org)76 points by djoldman 5 months ago | 22 comments