First screen, captured . Hover to scroll the page, or open the video.
Full page

Captured . Click for the whole screenshot.
Looks similar




Related stories
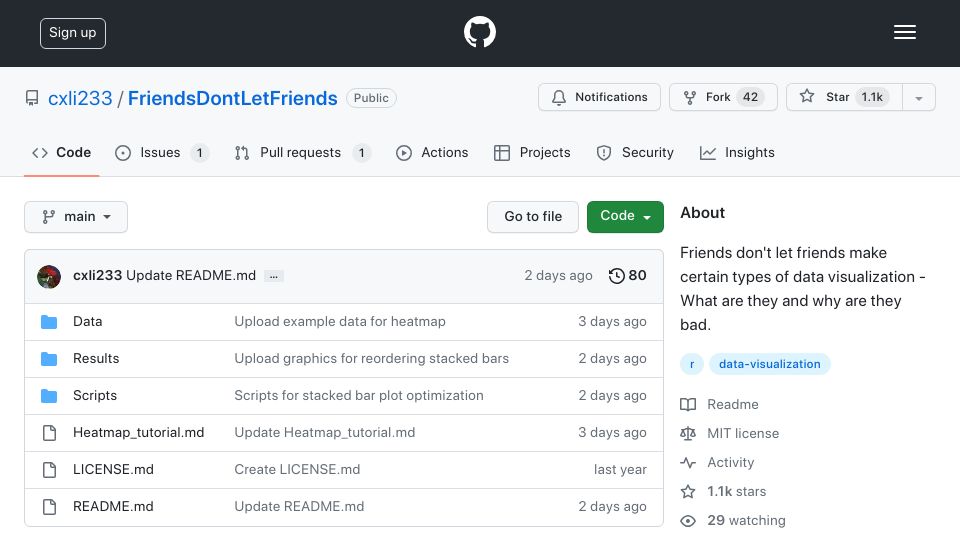
Friends don't let friends make bad graphs(github.com)
440 points by ZunarJ5 | 79 comments
GitHub repository explaining types of data visualizations to avoid and why they are misleading, with R scripts and example data.
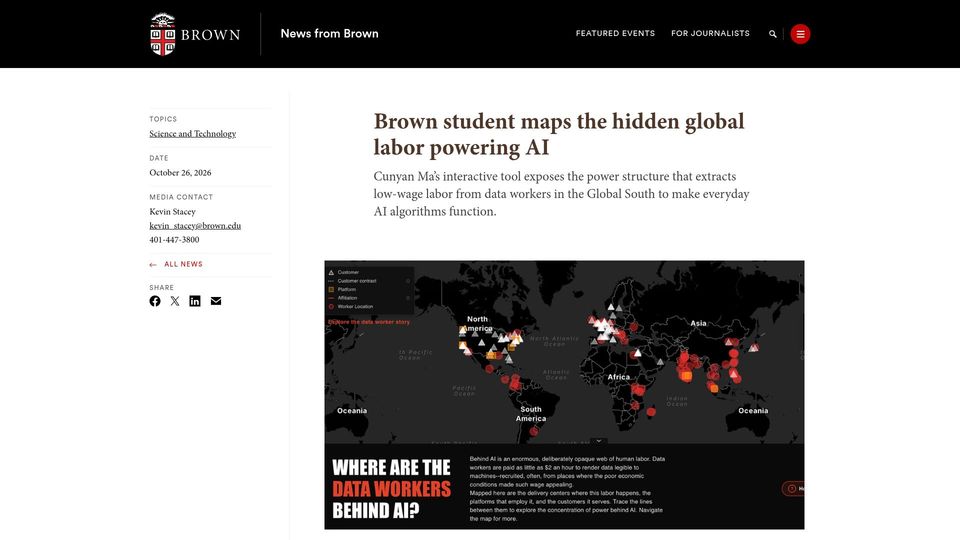
Brown student maps the hidden global labor powering AI(brown.edu)
162 points by cdrnsf | 164 comments
Brown University news article about student Cunyan Ma's interactive map linking tech companies and data labeling firms to low-wage AI data workers worldwide.

Visualizing all books of the world in ISBN-Space(phiresky.github.io)
458 points by phiresky | 85 comments
Blog post describing a visualization of over 100 million books mapped by ISBN, made in response to an Anna's Archive challenge.

Map of GitHub(github.com)
651 points by vortex_ape | 100 comments
GitHub repository for anvaka's Map of GitHub, an interactive map visualizing GitHub repositories as countries based on shared stargazers.
Visualizing World War II(nathangoldwag.wordpress.com)
410 points by gaws | 85 comments
A blog post on Goldwag's Journal on Civilization presenting visualizations and maps of World War II history.
This map is not upside down(maps.com)
341 points by aagha | 489 comments
Maps.com article by Joshua Stevens about a south-up world map designed by cartographer Robert Simmon that challenges the north-up convention.