Animations for System Builders(brooker.co.za)
55 points by KraftyOne | 3 comments
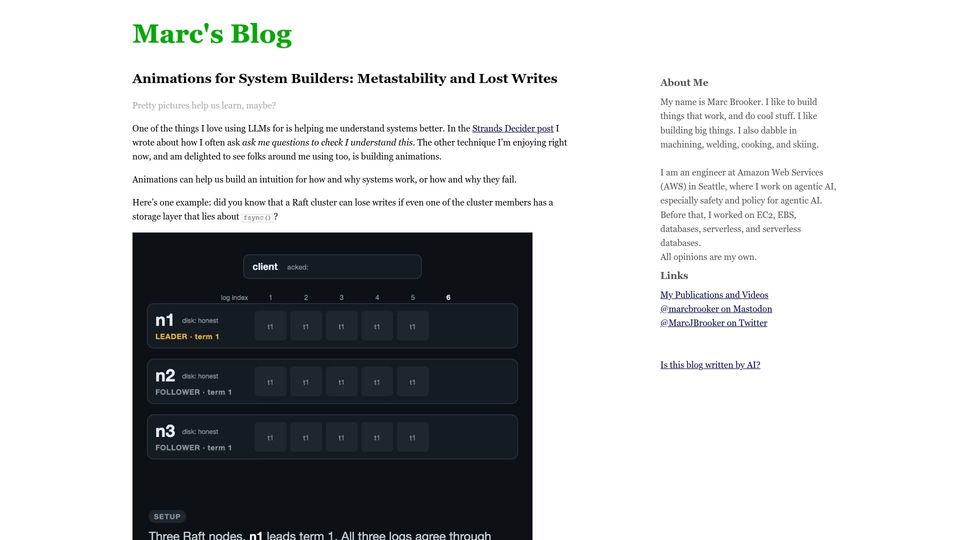
Marc Brooker blog post showing LLM-built animations of system failures: Raft lost writes from lying fsync, and metastable failures in Postgres and etcd.
30 stories tagged visualization, newest first.
55 points by KraftyOne | 3 comments
Marc Brooker blog post showing LLM-built animations of system failures: Raft lost writes from lying fsync, and metastable failures in Postgres and etcd.
68 points by klamike | 3 comments
lpviz is a browser-based interactive tool for visualizing and solving linear programming problems on a 2D/3D graph canvas.
78 points by seizethecheese | 27 comments
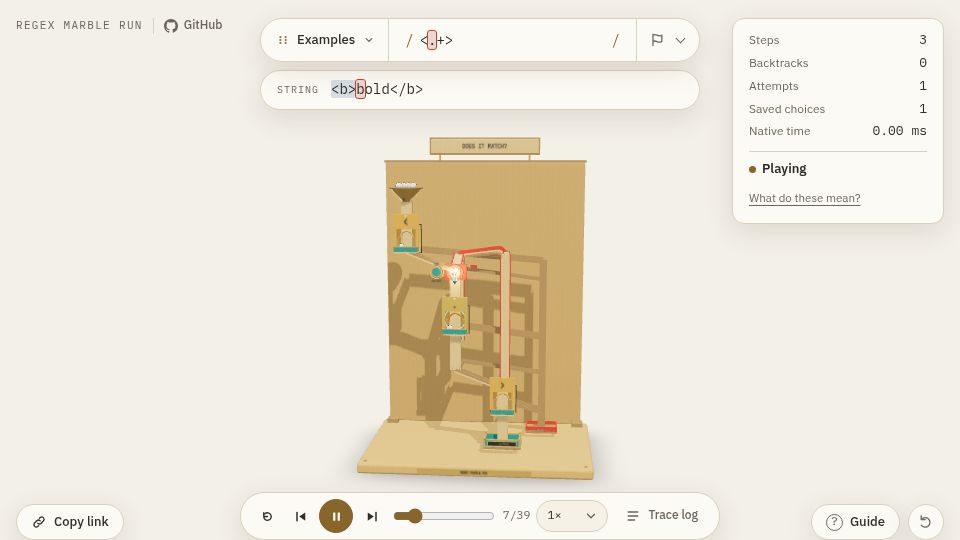
Regex Marble Run is an interactive web tool that visualizes regular expression matching and backtracking as a 3D marble run machine.

114 points by thclpr | 22 comments
Phloem is an interactive web visualization that renders a Git repository's commit history as a glowing, organically growing branching structure resembling a slime mold.

32 points by jonbaer | 37 comments
Landing page for Agent Standup, a tool that visualizes Claude Code sessions as a live stand-up meeting where a lead agent directs sub-agents who report back.

24 points by ampdot | 10 comments
An X post showing a prototype font in which every LLM token is rendered at equal width, illustrating how models see text and their quirks.
576 points by aray07 | 85 comments
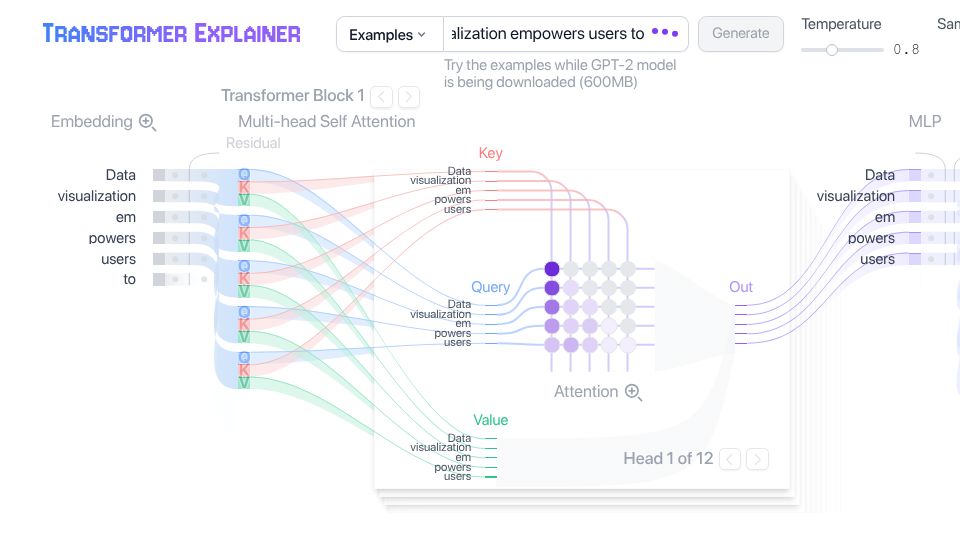
Transformer Explainer is an interactive in-browser visualization that runs GPT-2 and shows how embeddings, multi-head self-attention, and MLP layers process text.
350 points by danielmorozoff | 79 comments
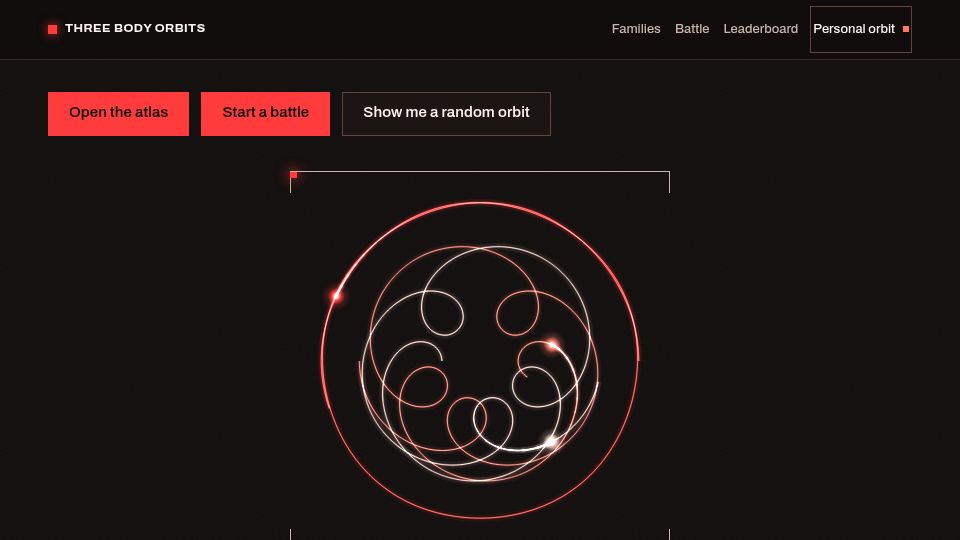
An interactive web atlas of periodic three-body orbits with animated visualizations, orbit families, a battle mode, and a leaderboard.
867 points by jonbaer | 84 comments
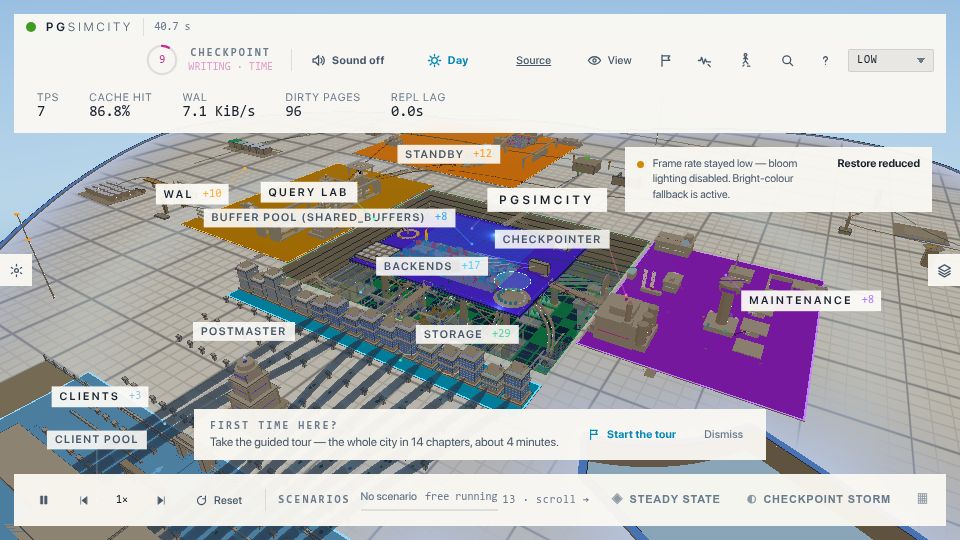
An interactive 3D city simulation visualizing PostgreSQL internals like WAL, buffer pool, checkpointer, backends, and replication, with a guided tour.
449 points by aplavin | 161 comments
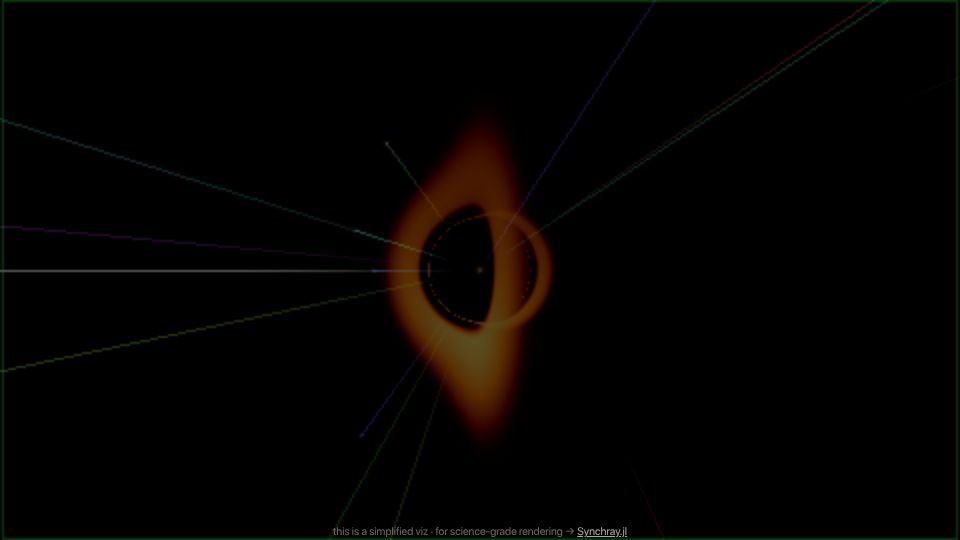
Interactive browser app rendering a physically accurate black hole with relativistic ray bending and Doppler boosting, viewable on screen, in AR/VR, or lensing your camera feed.
459 points by hexagr | 94 comments
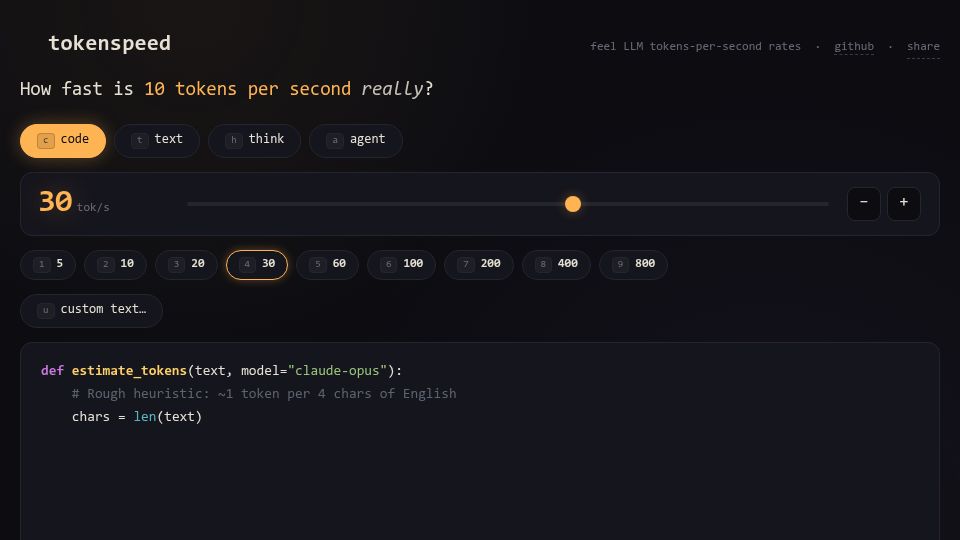
Interactive web tool that simulates LLM output streaming at selectable tokens-per-second rates for code, text, thinking, and agent modes.
468 points by auraham | 85 comments
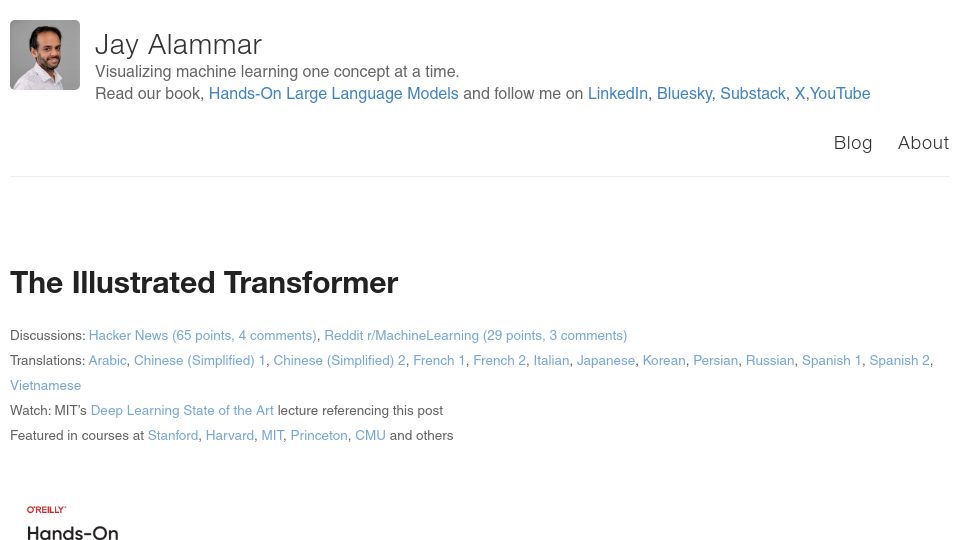
Jay Alammar's illustrated blog post explaining the Transformer neural network architecture and its self-attention mechanism with visual diagrams.

413 points by Bogdanp | 86 comments
An interactive visual explainer introducing dithering, the first part of a series on visualrambling.space, navigated by tapping through slides.
568 points by gmays | 39 comments
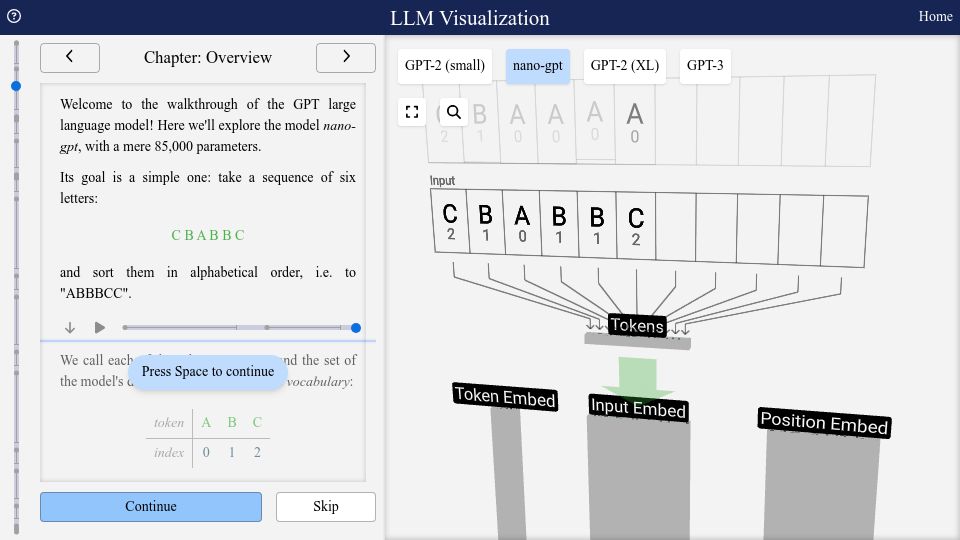
An interactive 3D visualization and walkthrough of how a GPT large language model works, starting with a tiny nano-gpt model that sorts letters.
388 points by pykello | 65 comments
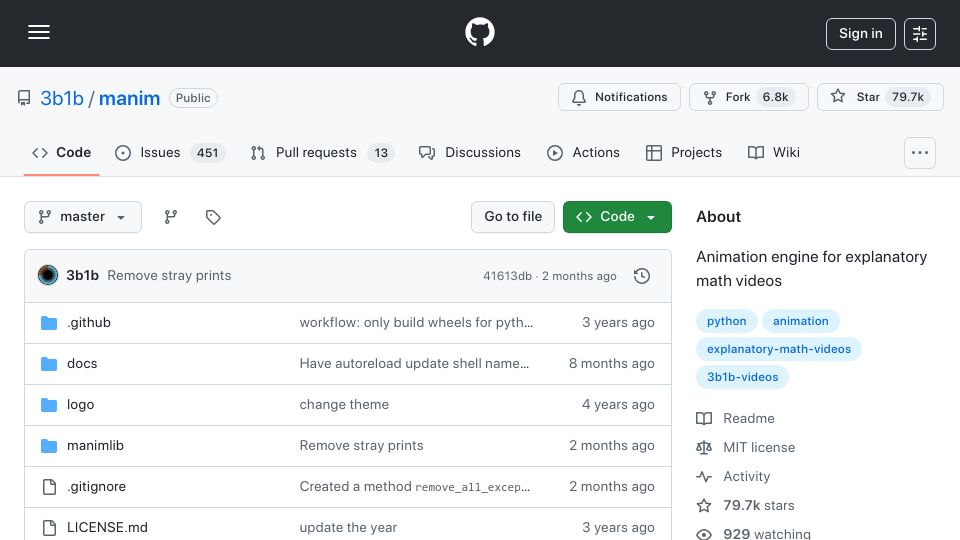
GitHub repository for Manim, 3Blue1Brown's Python animation engine for creating explanatory math videos.
402 points by eric-burel | 78 comments
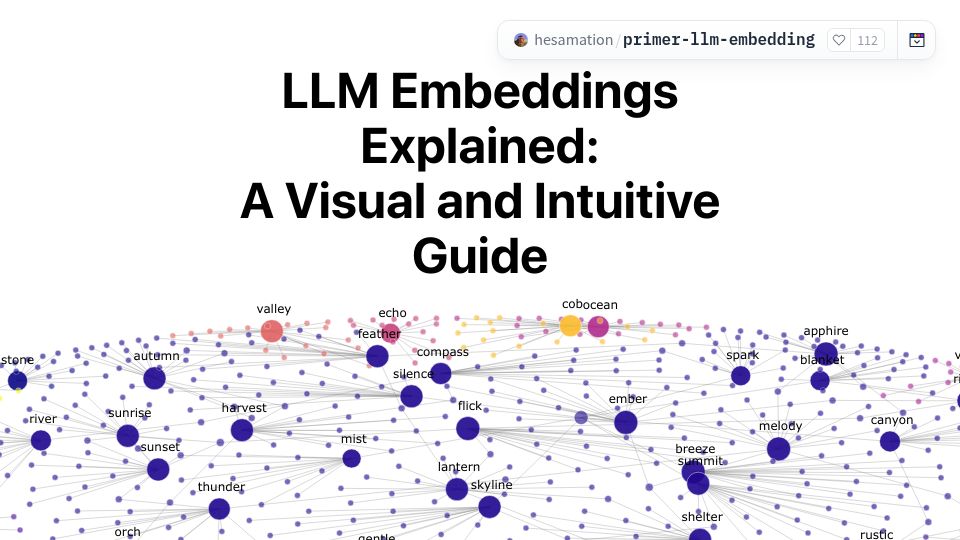
A Hugging Face Space hosting a visual, intuitive guide explaining how embeddings work in large language models.
896 points by bookofjoe | 241 comments
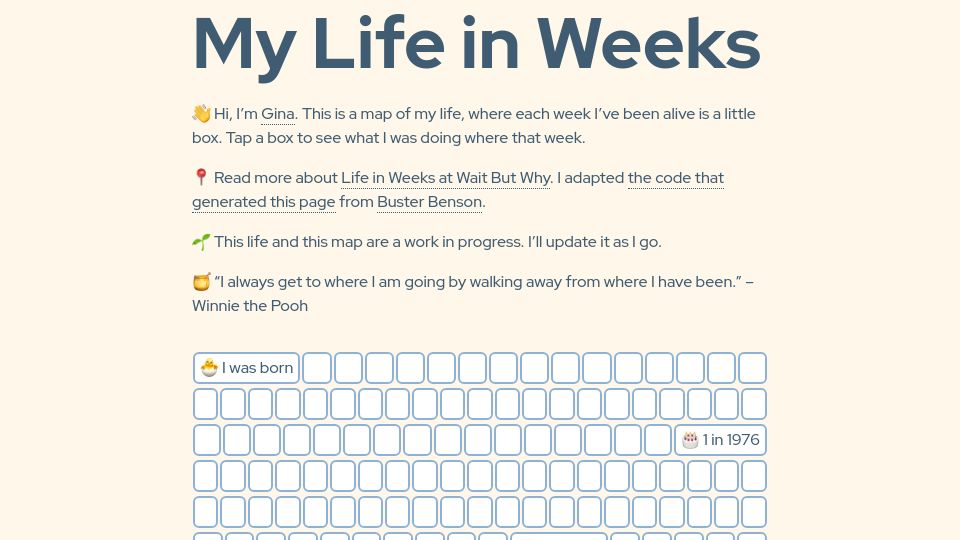
Gina Trapani's personal site mapping each week of her life as a box, with annotations for life events, adapted from Buster Benson's code.
417 points by desgeeko | 53 comments
Documentation page in the pdfsyntax GitHub repo describing a browse feature that renders a PDF file's internal structure as navigable HTML.
419 points by piebro | 91 comments
GitHub repository for a tool and web demo that artfully visualizes Factorio blueprints, updated for Factorio 2.0 and Space Age.
701 points by pieix | 116 comments
Atlas of Space is an interactive browser-based visualization of the Solar System that simulates orbits of planets, moons, and asteroids using Newtonian physics.
479 points by ulrischa | 119 comments
Homepage of Diagrams, a Python library that lets you draw cloud system architecture diagrams in code.
367 points by vnglst | 39 comments
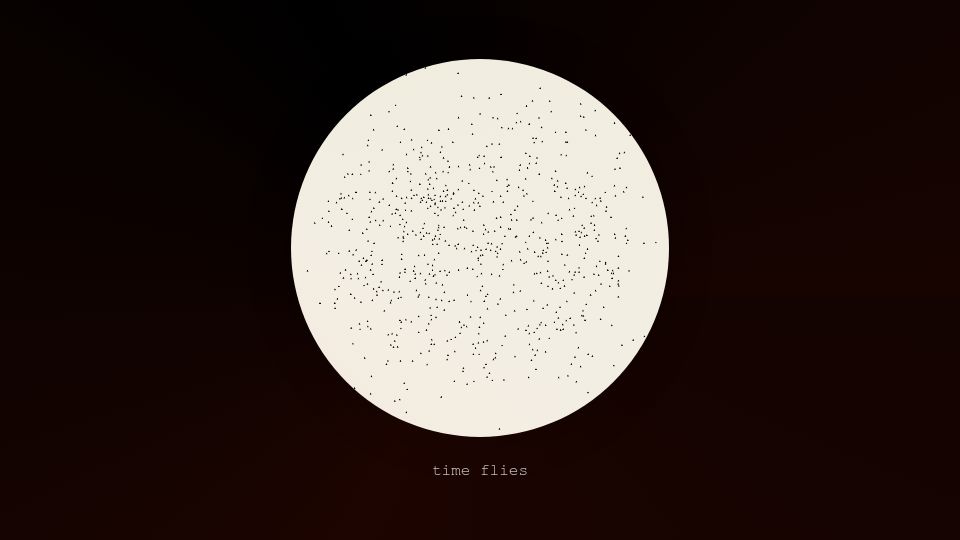
An interactive single-page JavaScript visualization depicting the passage of time as flies swarming inside a circle, labeled "time flies."
559 points by gaws | 83 comments
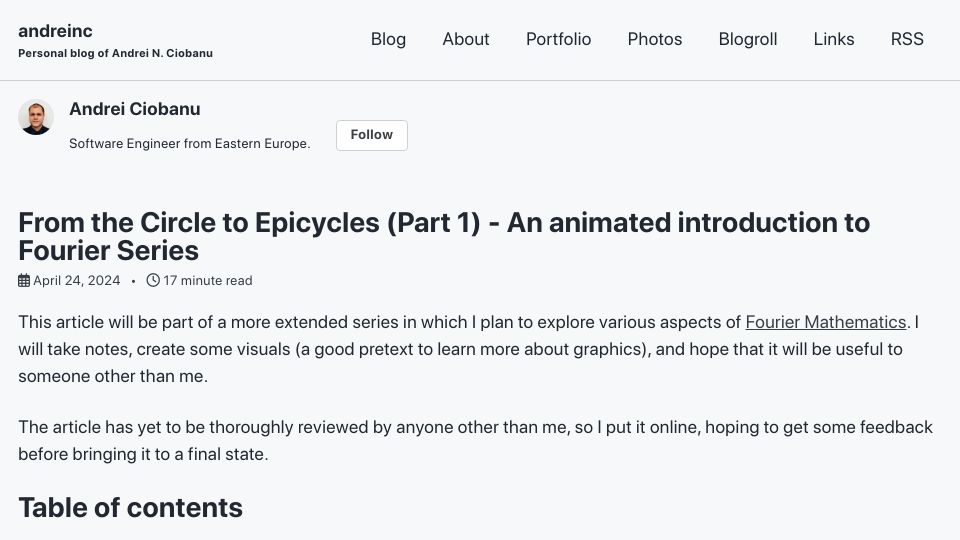
A blog post by Andrei Ciobanu giving an animated, visual introduction to Fourier series, starting from circles and building up to epicycles; part 1 of a series.

441 points by kiyanwang | 108 comments
Homepage of Penrose, a CMU project for creating mathematical diagrams by writing plain-text notation, with examples, tutorial, and online editor.
910 points by jonbaer | 1 comments
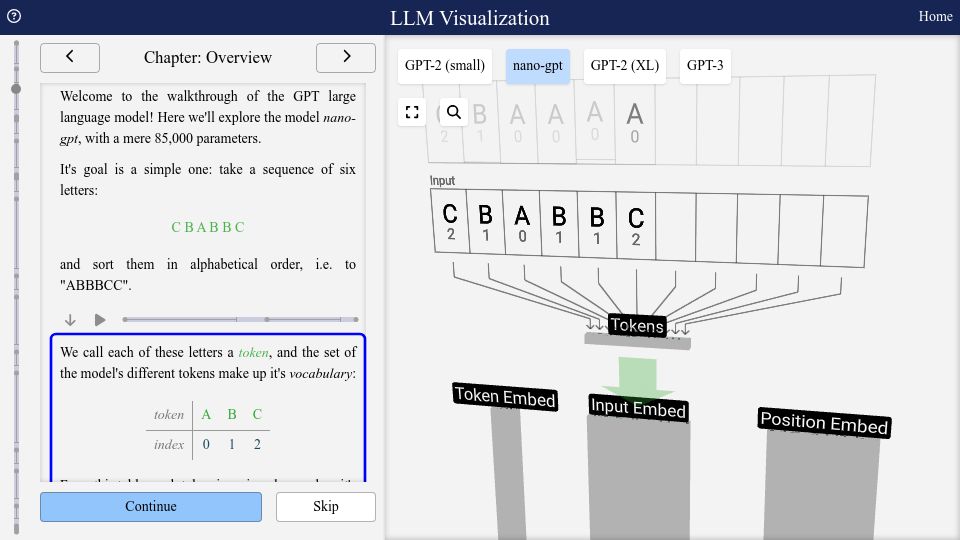
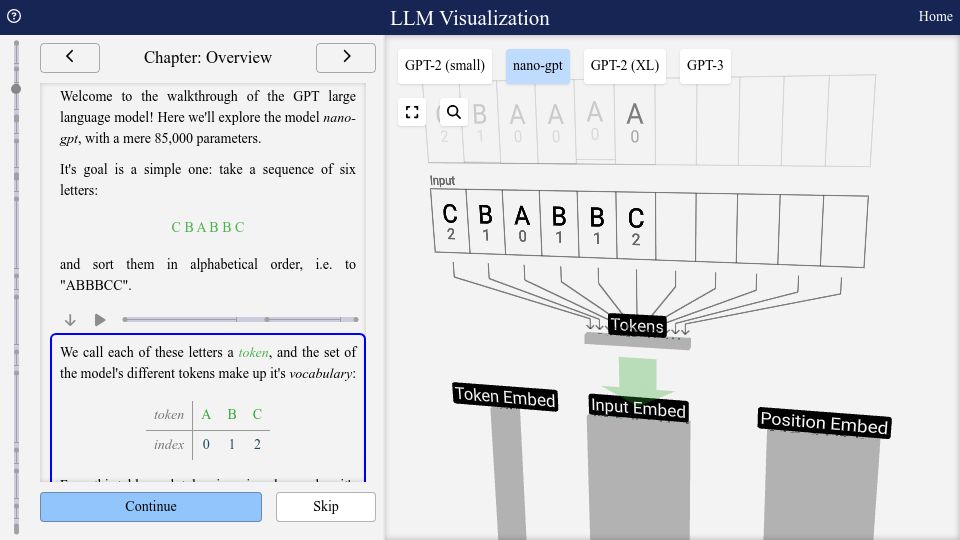
An interactive 3D walkthrough visualizing how a GPT-style large language model works, step by step, using nano-gpt, GPT-2, and GPT-3 examples.
1512 points by plibither8 | 129 comments
An interactive 3D walkthrough visualizing how a GPT large language model works, starting with a tiny nano-gpt model that sorts letters.
642 points by qwertyforce | 55 comments
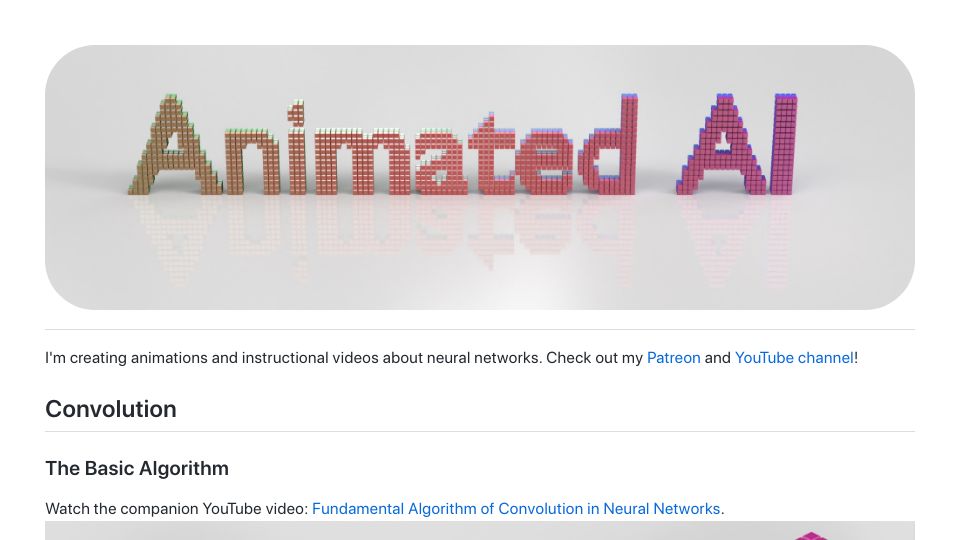
Animated AI is a site of 3D animations and instructional videos explaining neural network concepts, starting with the basic convolution algorithm.
407 points by benpm | 81 comments
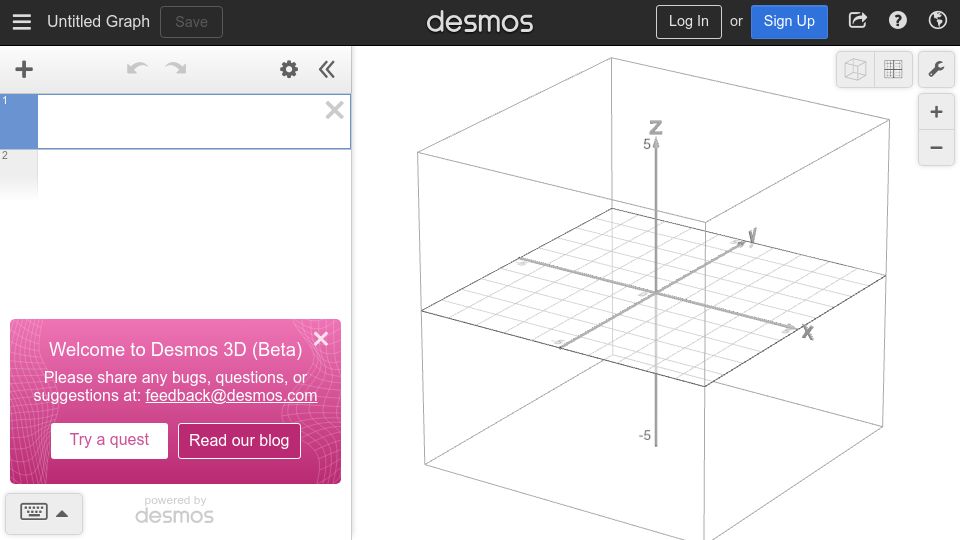
Desmos 3D (Beta), a free browser-based 3D graphing calculator showing an empty x-y-z plotting space and expression list.
366 points by mr_o47 | 25 comments
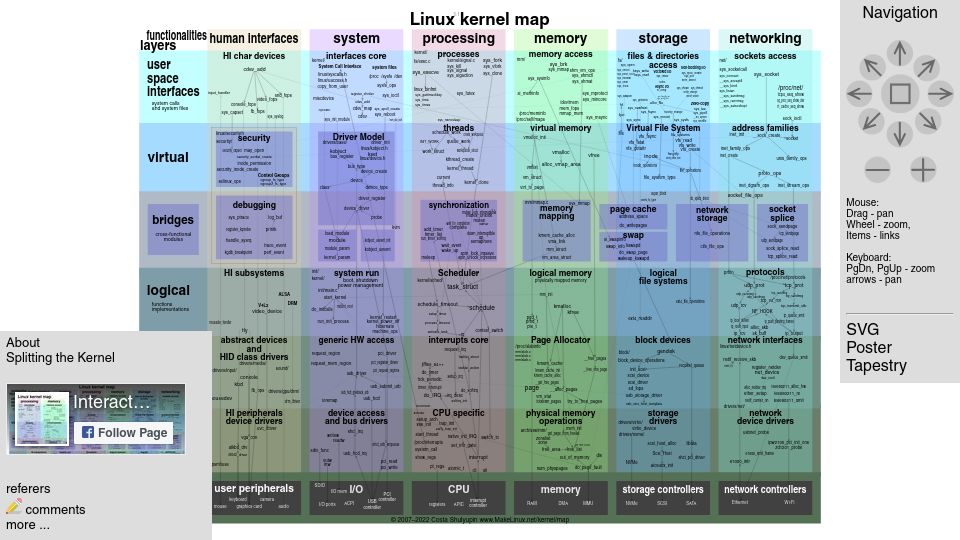
An interactive, zoomable SVG map of the Linux kernel showing its subsystems, layers, and functions with links to source code.

1271 points by nivethan | 199 comments
An interactive Neal.fun page where users scroll upward from the ground through the atmosphere into space, seeing what exists at each altitude.